Measuring stand S5
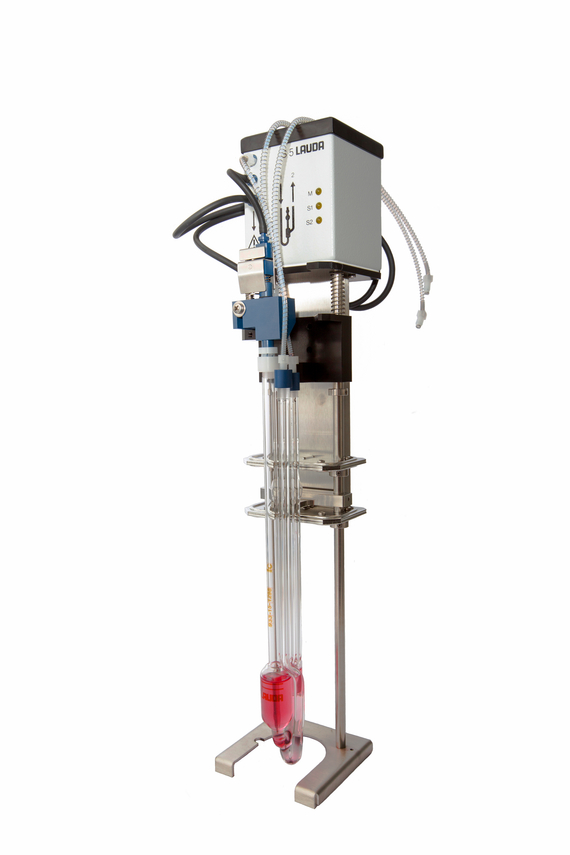
The S5 is the measuring part of the PVS system. Its head is comprised of the opto-electronic meniscus detectors as well as the entire control of the measuring process including miniature pump and valves.
The accuracy and resolution of the light sensor measurement system is among the best of its class. The robust micro-pump for pushing the sample up into the measuring ball as well as the chemical-resistant valves in the head of the stand allows reliable and continuous operation.
Special Features:
- Completely micro-processor controlled for a highly precise time measurement
- Adaptive infrared (NIR) detection
- Short tubing to the viscometer
- Electrical connections only
- For (Micro-) Ubbelohde, Cannon-Fenske-Routine and Micro-Ostwald capillaries
Technical features:
|
Sample temperature range |
-65...160 °C |
|
Time measurement range |
0...9,999.99 s |
|
Recommended measurement range of flow time |
30...1,000 s |
|
Viscosity range |
0.3...50,000 mm2/s |
|
Resolution of time measurement |
0.01 s |
|
Meniscus detection |
Optical (infrared) |
|
Light sensor control |
Digital (μP) |
|
Dimensions (W x D x H) |
90 x 90 x 500 mm |
|
Weight, net |
4.5 kg |
Control unit PVS Box
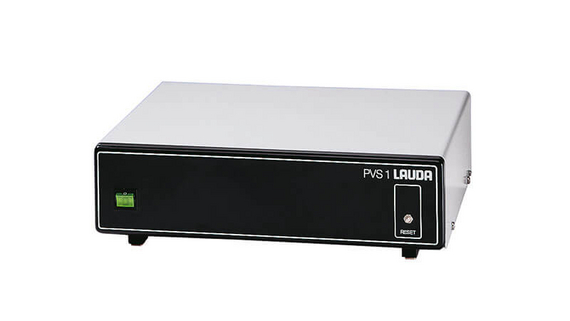
The PVS control unit is the core of the system as well as the switching station between the PC and individual components. It can be equipped with up to four plugin-in boards depending on the configuration (up to 8 S5 stands, up to 4 VRM modules, up to 4 MT dosing systems and 4 motor locks on the VAS auto-sampler systems).
Technical features:
|
Interface to the PC |
RS 232 C |
|
Dimensions (W x D x H) |
340 x270 x 105 mm |
|
Weight, net |
4.6 kg |
|
Ambient temperature |
10...45 °C |
|
Total power consumption |
100 W |
|
Compatible Windows versions |
7, 8, 8.1, 10, 11 |
Software based on Windows
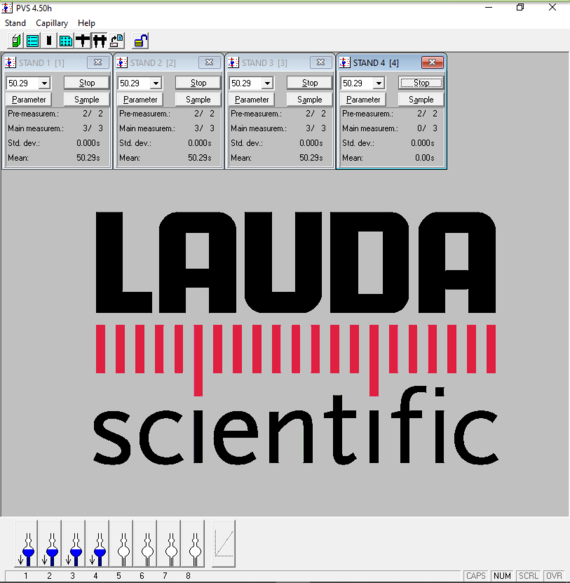
All PVS system configurations are controlled by a standard PC through an interface. In addition, the high-performance and user-friendly standard version of the software calculates the intrinsic, kinematic, dynamic, relative, reduced and inherent viscosity and the K-value from the measured running times. Further key material properties can be determined using additional software modules.
The measuring results and evaluations can be printed out and saved in a file in ASCII format. The measurements report logs all measuring data on a day in chronological order and saves them in a file marked with the day‘s date. This data can be viewed at all times which means that consistent documentation is guaranteed. Further processing in other programs like MS Excel and in other networks is possible.
Further information
Request our complete catalog
Request our complete catalog "Product range 2025/2026" now. It contains a detailed overview of all products, accessories and spare parts of our viscosity measuring systems on more than 50 pages.
Available as digital or printed version in English language.


